Trace flows in flow designer
Debug Function in a flow by using trace view
During orchestrating any flow, the Function task is used to put together any custom business logic. There can be situations wherein this custom logic is to be debugged for the values that are received from or generated in the Function block. This blog describes how to introduce debug or trace statements in the Function blocks and then how to view the corresponding trace statements.
To debug the flows, a time-bound trace URL needs to be generated and any traces that are generated by the flow can be viewed that uses a Trace View.
Here are a few use cases where the business logic has been added in Function :-
Multi-step user registration
Orchestrating user registration with risk evaluation
User registration into a different Identity Provider
This blog explains the usage of trace view in Flow Designer through a simple use case explained in the blog.
Overview of the flow
Consider that you have created a flow to achieve "Identity Source Routing" by following the instructions provided here.
Before we delve into specifics, let's revisit the building blocks of the flow.
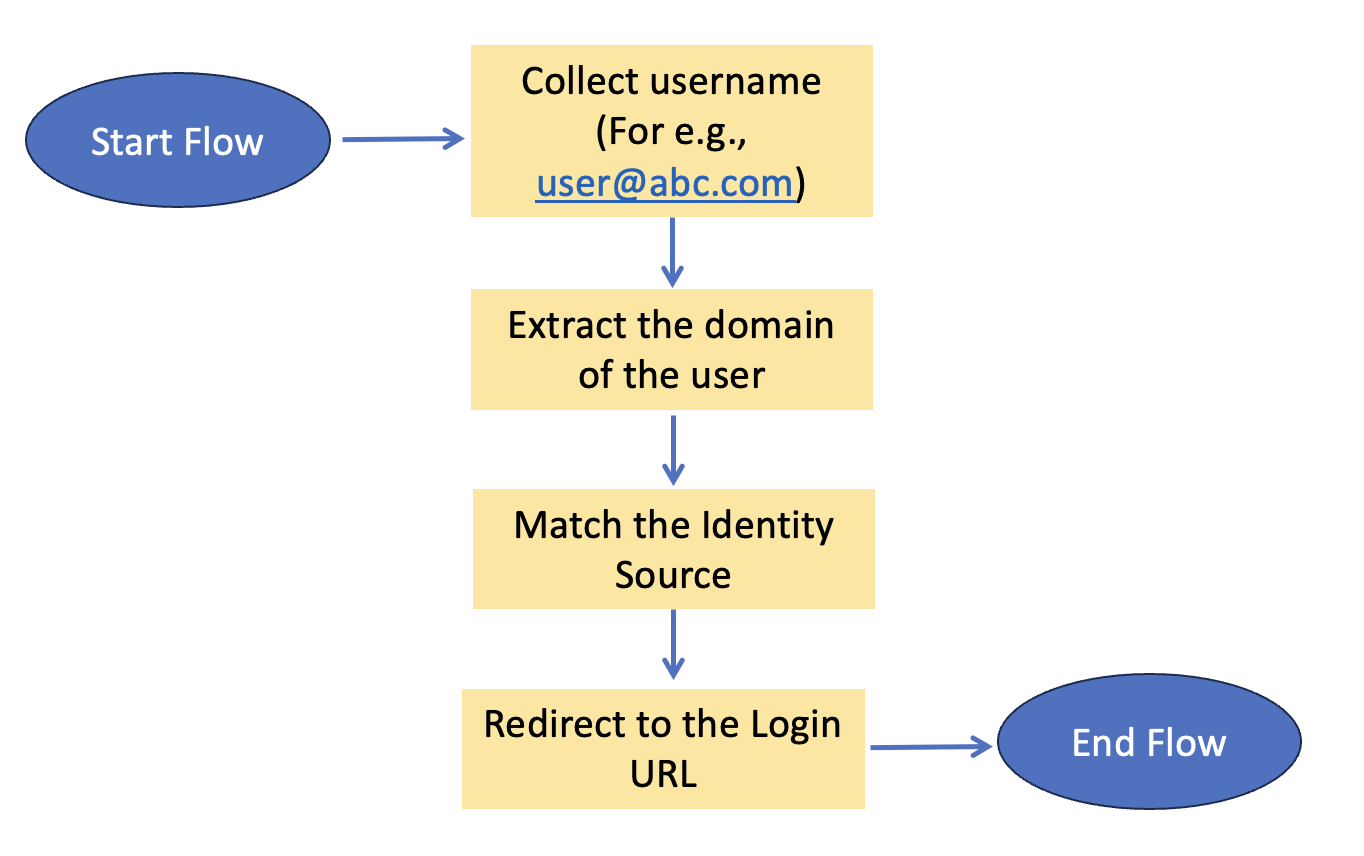
The flow starts with asking the user for the username. This is a simple custom page. Once the username is submitted, the system runs a set of rules to determine the identity source that should be used to authenticate. The user is then directed to login with that identity source.
While designing the flow, there might be a case where function code needs to be edited to better understand how the redirection URL is crafted. To accomplish the same, you may need to troubleshoot a complex function. This is the most common use case where the Trace viewer becomes useful.
Import the workflow
-
To import the model, login to your Verify Tenant as the administrator and switch to the admin interface.
-
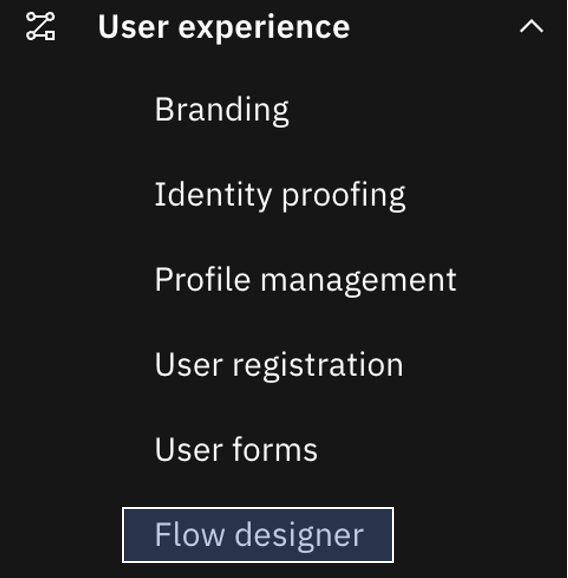
Navigate to the Flow designer.
-
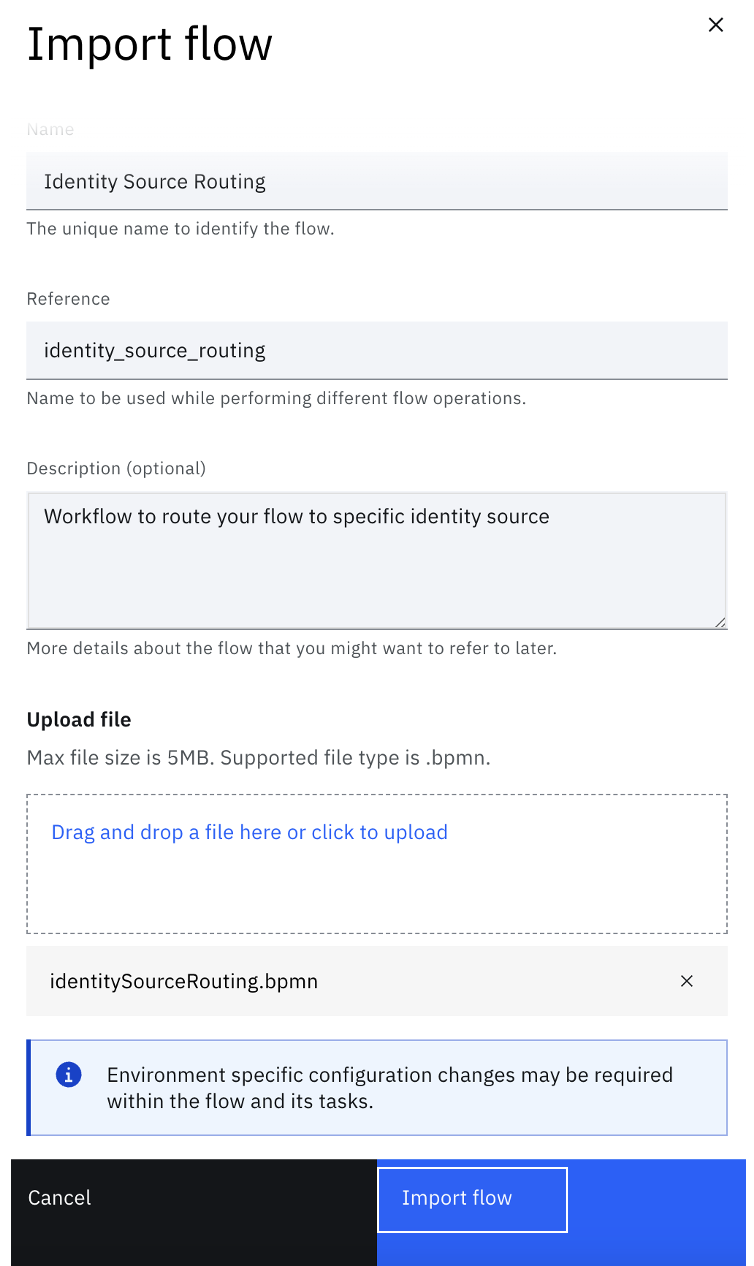
Click the Import icon next to the Create flow button.

-
Complete the details and upload the file that is at "$GIT_REPO/flows/identity_source_routing/identitySourceRouting.bpmn".
-
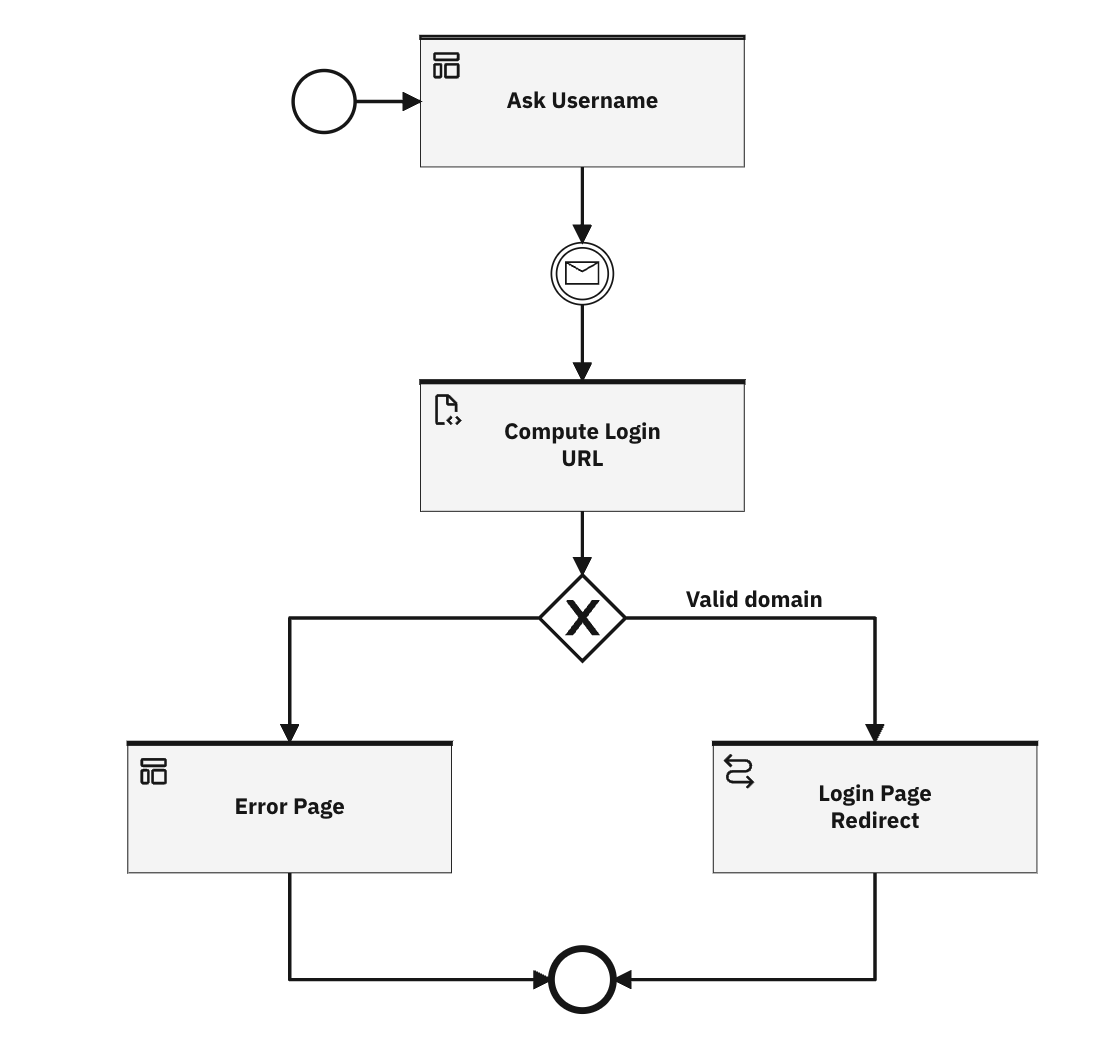
Once imported, the flow shows up as follows in the Flow designer.
-
Click Save changes to save the workflow in Draft mode.
-
Once all changes are made, Publish the workflow.
-
Click the Function task.
The Function computes the Identity Source corresponding to the given user. The username is expected to be in the email format and the allowed domains are mapped to an identity source realm.
If there are issues in deducing the Identity Source or the flow is not being redirected as expected, you can add additional statements to debug the mapping rules, following semantics explained here:

Generating the trace URL for the flow
Once published, start the flow with a trace URL to generate traces.
-
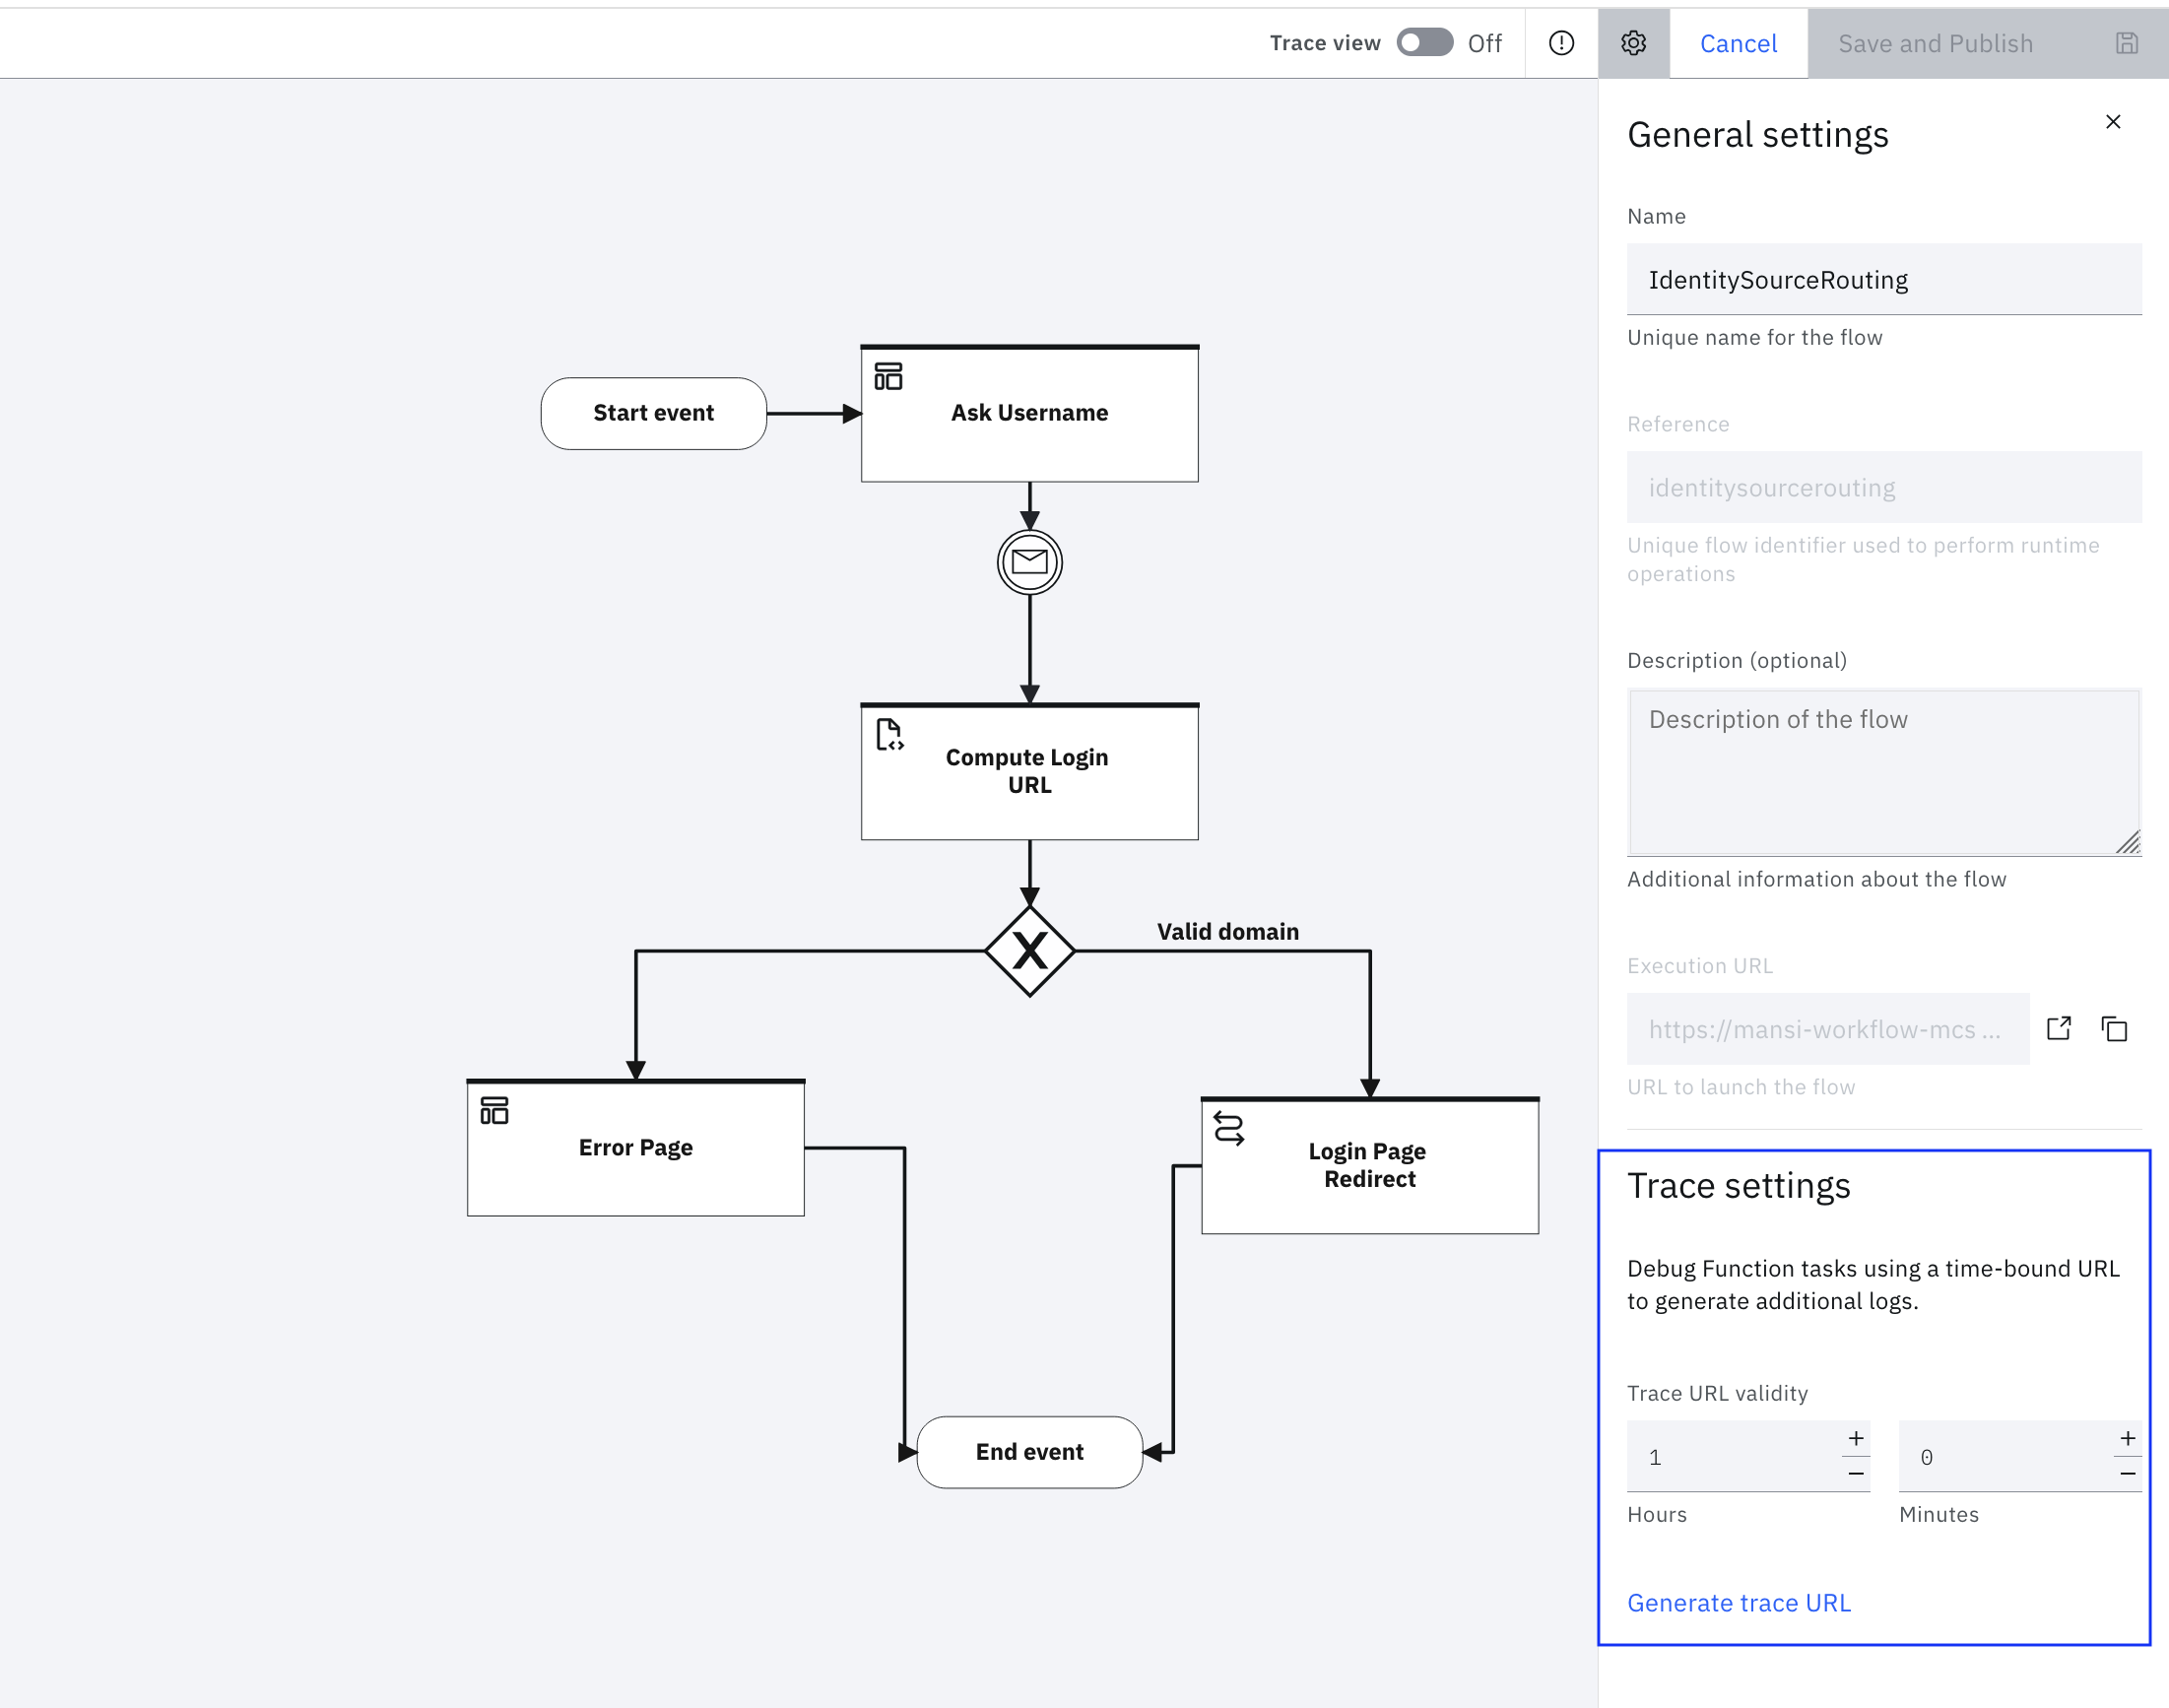
Open the Settings section by clicking the "Settings" icon.
-
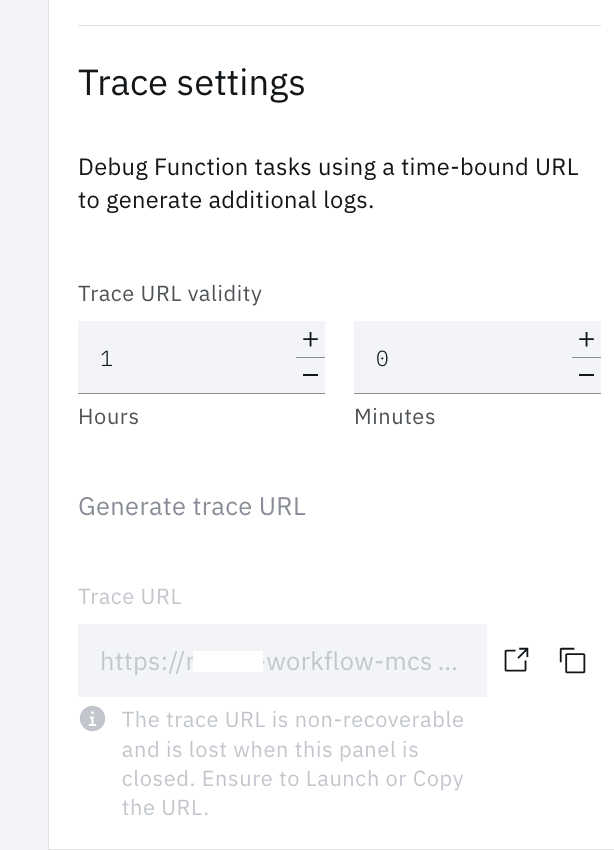
Click Generate trace URL in the Trace settings section. You may specify the Trace URL validity. The Trace URL validity can be max up to 8 hours and the default is 1 hour. This generates a time-bound URL to generate trace logs for the Function task in the flow.
Running the flow in trace mode
- Start the flow by using the trace URL generated in the previous step. When the flow is executed with the trace URL, then all the debug statements in the Function task in the flow are executed.
- The debug statements are executed and corresponding logs are generated.
- These logs can be viewed in a trace view.
Enable trace view in Flow Designer
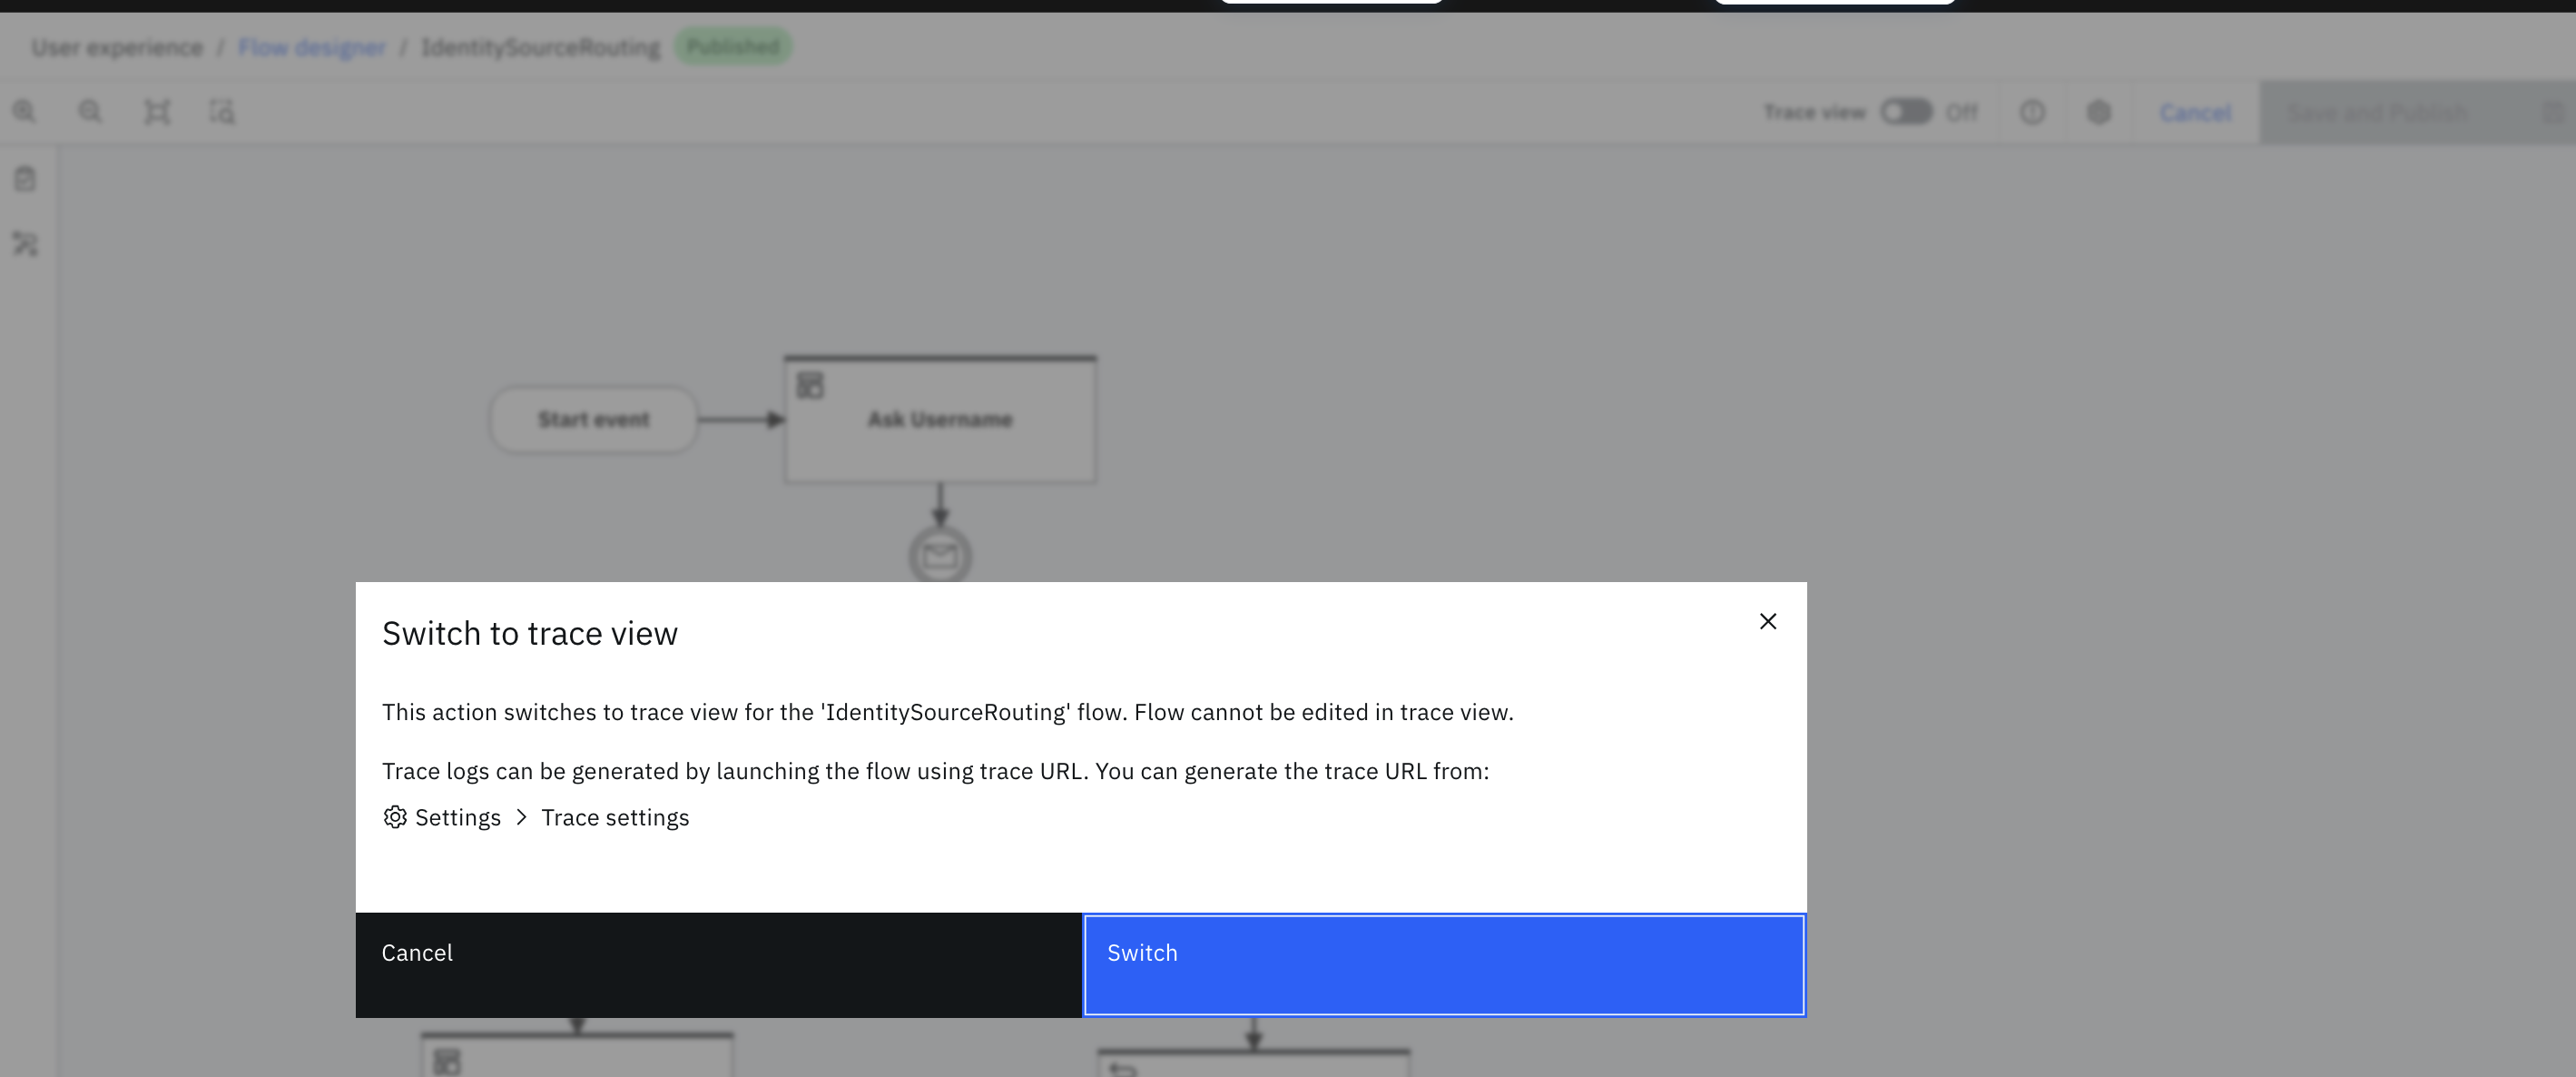
- Trace logs can be viewed in the Trace view. By default, Trace view is disabled. To enable the Trace view, click the toggle button from the Flow Designer screen.

- Switch to trace view confirmation dialog box appears. Click Switch to proceed.
Note: The flow cannot be edited in the trace view.
Trace view
- Trace view lists all instances that are executed OR running in trace mode.
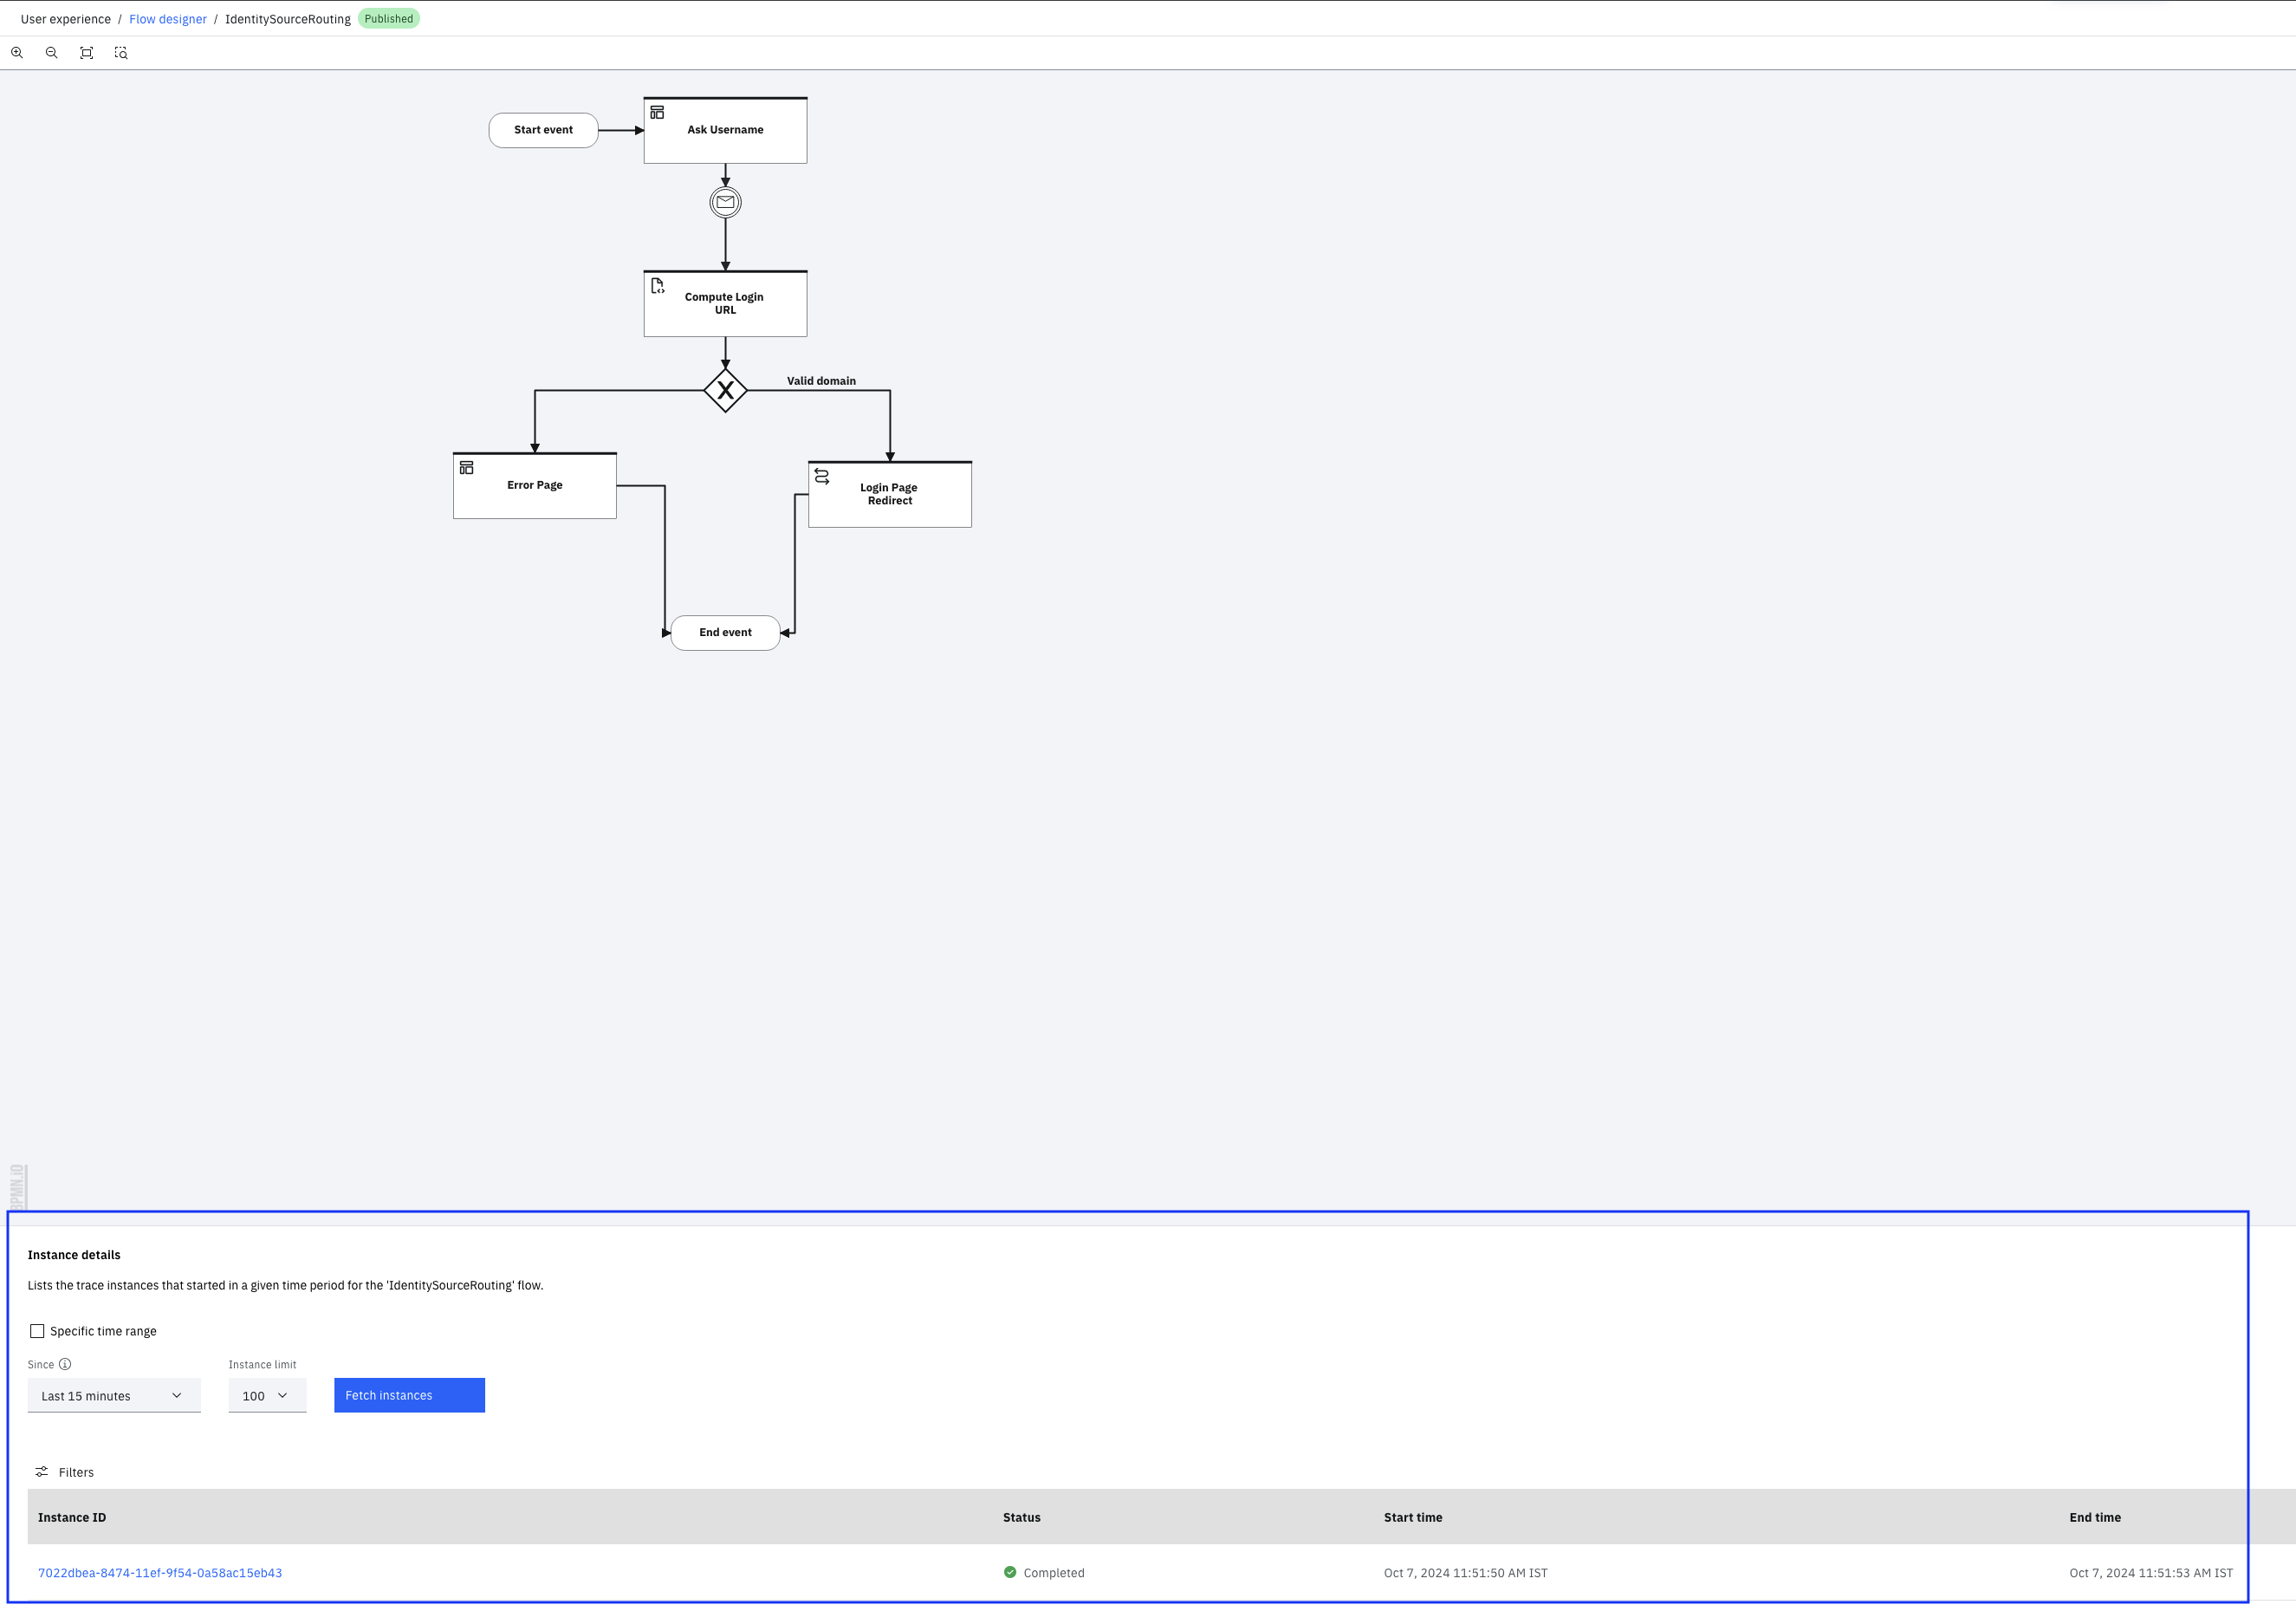
- Click instance ID to view the traces for that instance.
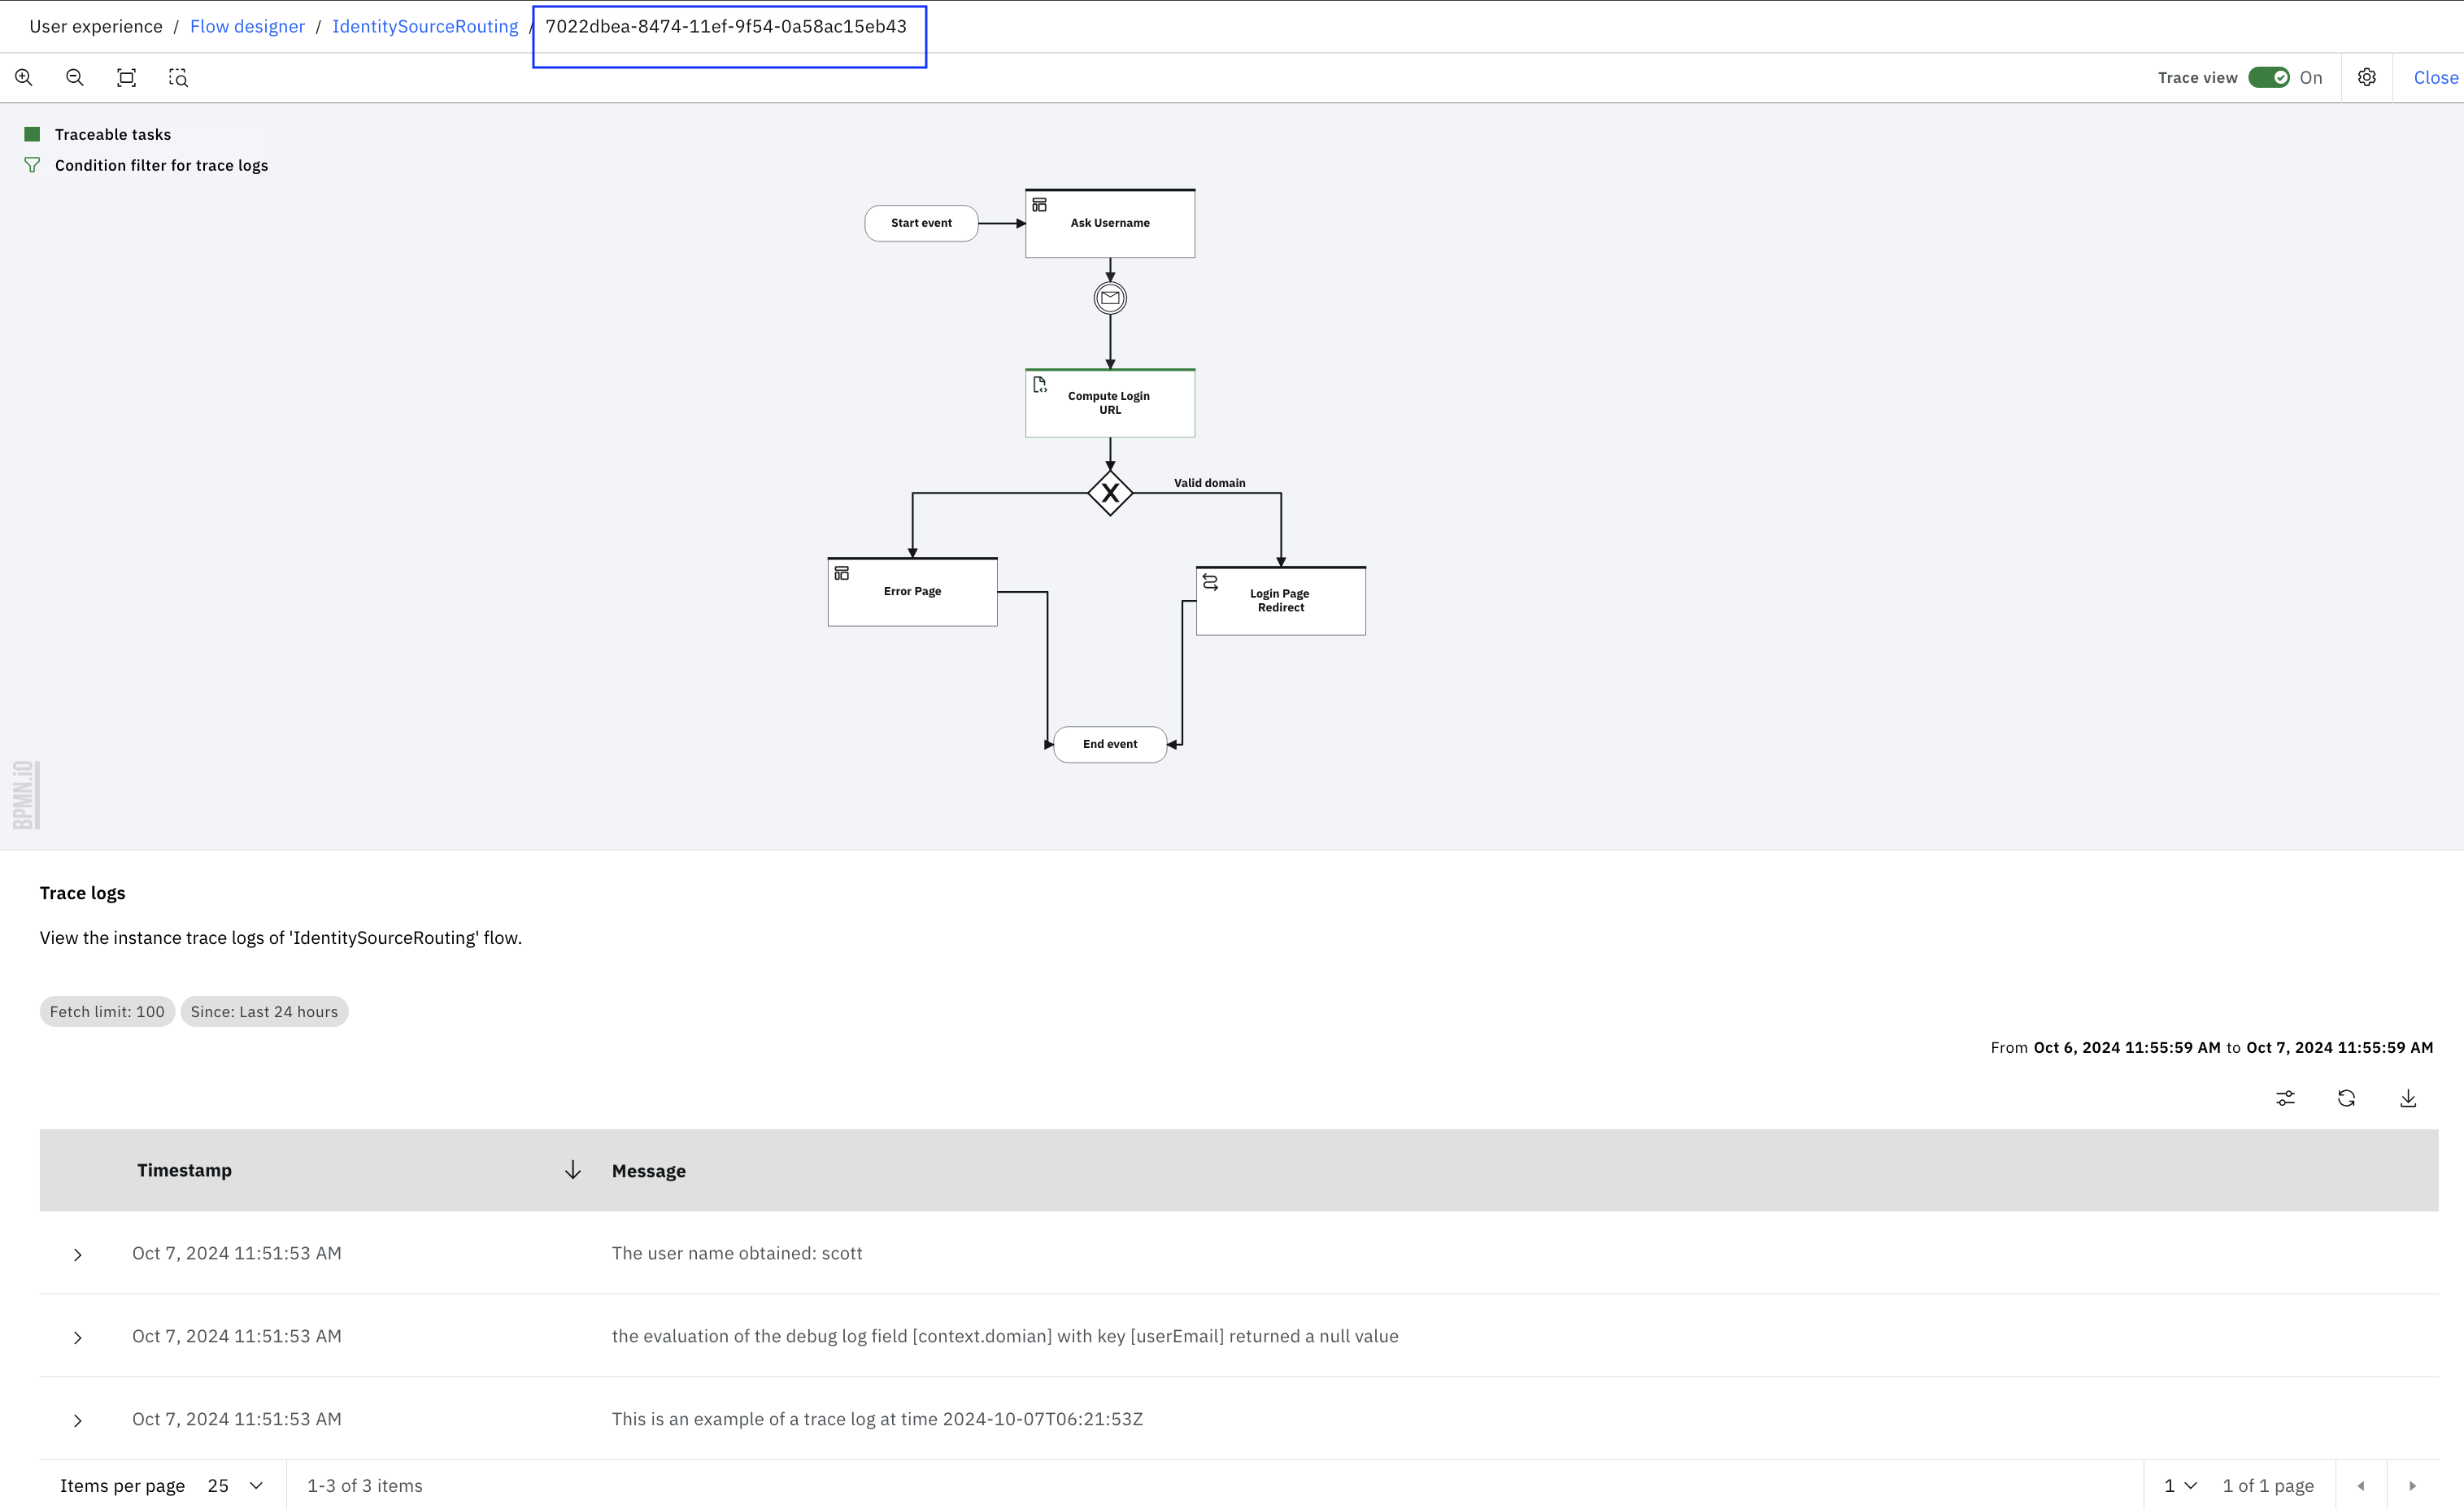
- Click the Function task to filter the traces for that particular task. If there are multiple function tasks in a flow, then each task can be clicked to view the trace logs corresponding to the selected task. The user can update the model based on the findings in the trace, republish, and use the same.
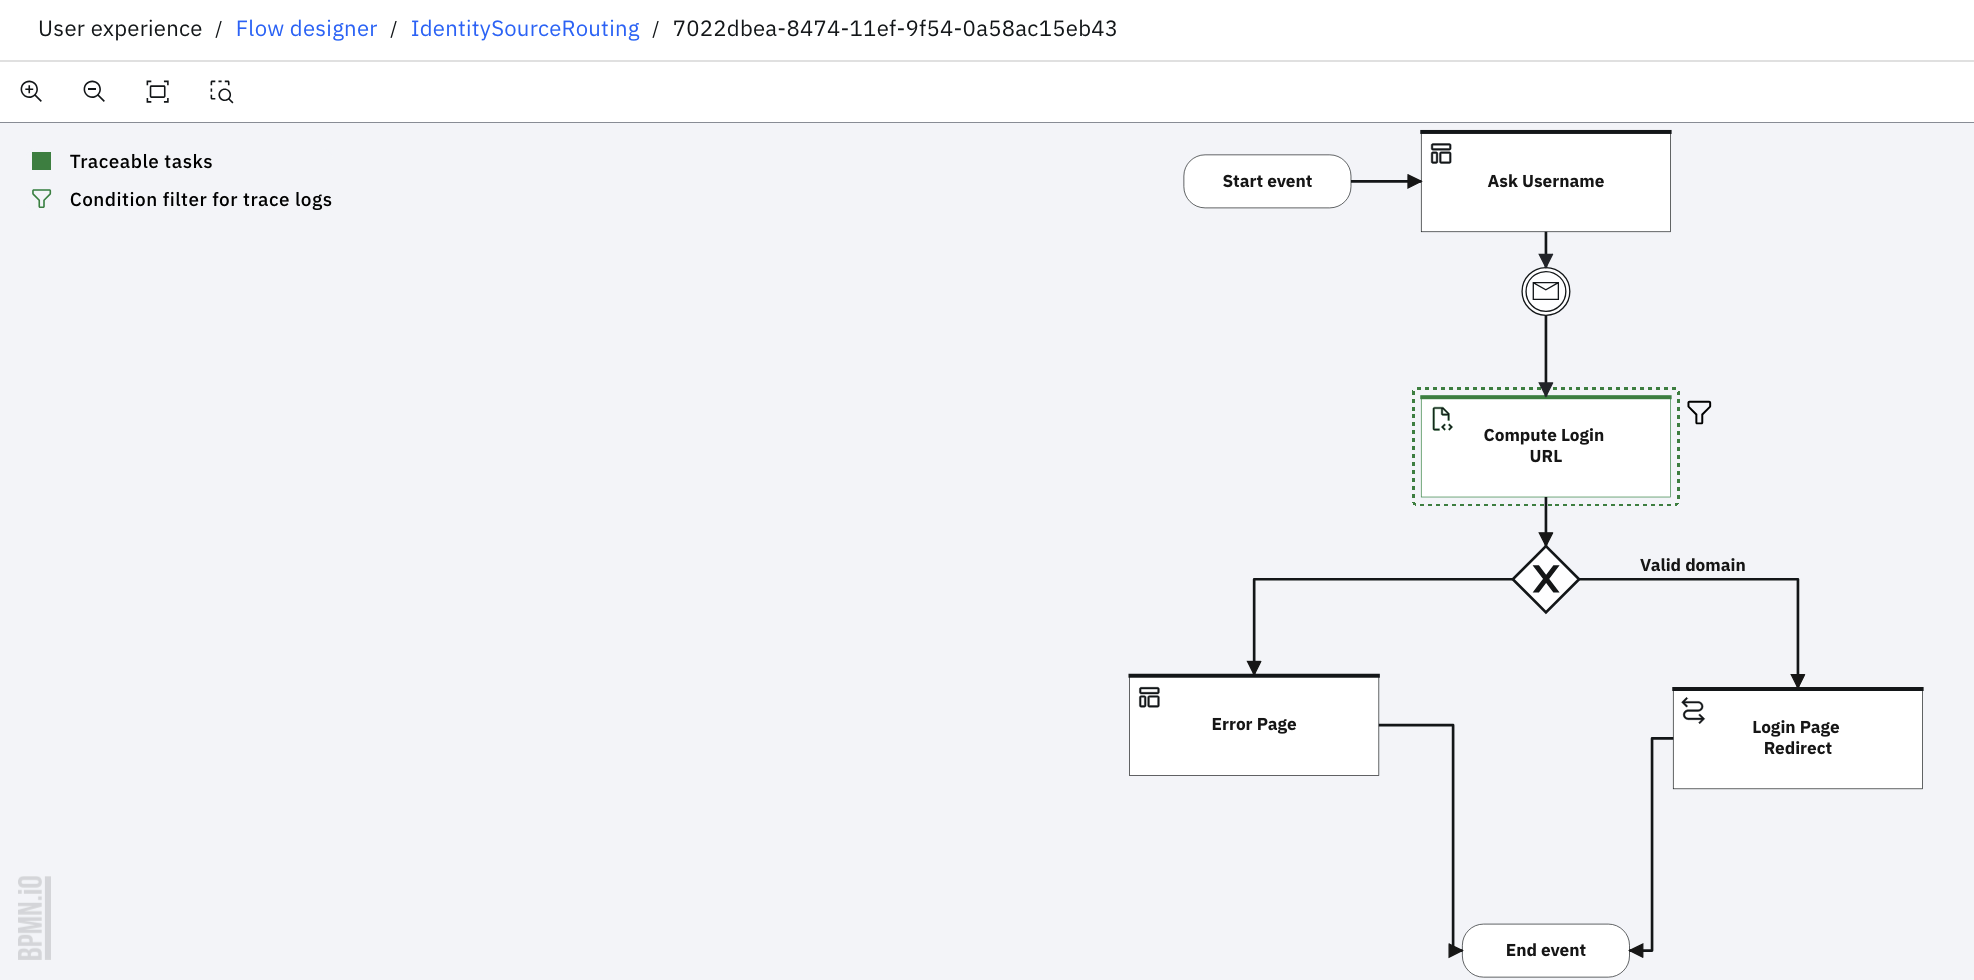
- Trace logs can be downloaded and also filtered based on custom criteria.

The wrap
The trace view in Flow designer provides a quick and easy way to debug Function task in a flow. Additionally, it allows to filter trace logs through the function name. The trace logs can be downloaded and also filtered based on custom criteria.
Updated 7 days ago
