ELK Stack for monitoring
Introduction
IBM Verify provides a rich set of events that are collected as part of its operations and transactions. Making use of these events to deliver insights, which implies ingesting and storing them in a central location, is critical to any solution.
This guide will show how to integrate IBM Verify with an ELK (Elasticsearch, Logstash, Kibana) Stack deployment by reading events from IBM Verify and sending them to the ELK stack. This will utilize a tool running under nodejS.
Pre-requisites
You will need a client id and client secret from your IBM Verify tenant which has the Read reports permission required to read event data. Check out this guide to creating an API client.
You will need to be familiar with the nodeJS-based tooling stack from IBM Security Expert Labs.
You can download or clone it here.
You should be familiar with the ELK stack.
Architecture
The integration tool described in this guide runs as a nodeJS process that pulls events from IBM Verify, prepares the events, and pushes them into the ELK stack. As part of each successful pull and push it will write a tombstone so it can continue where it left off after a restart.
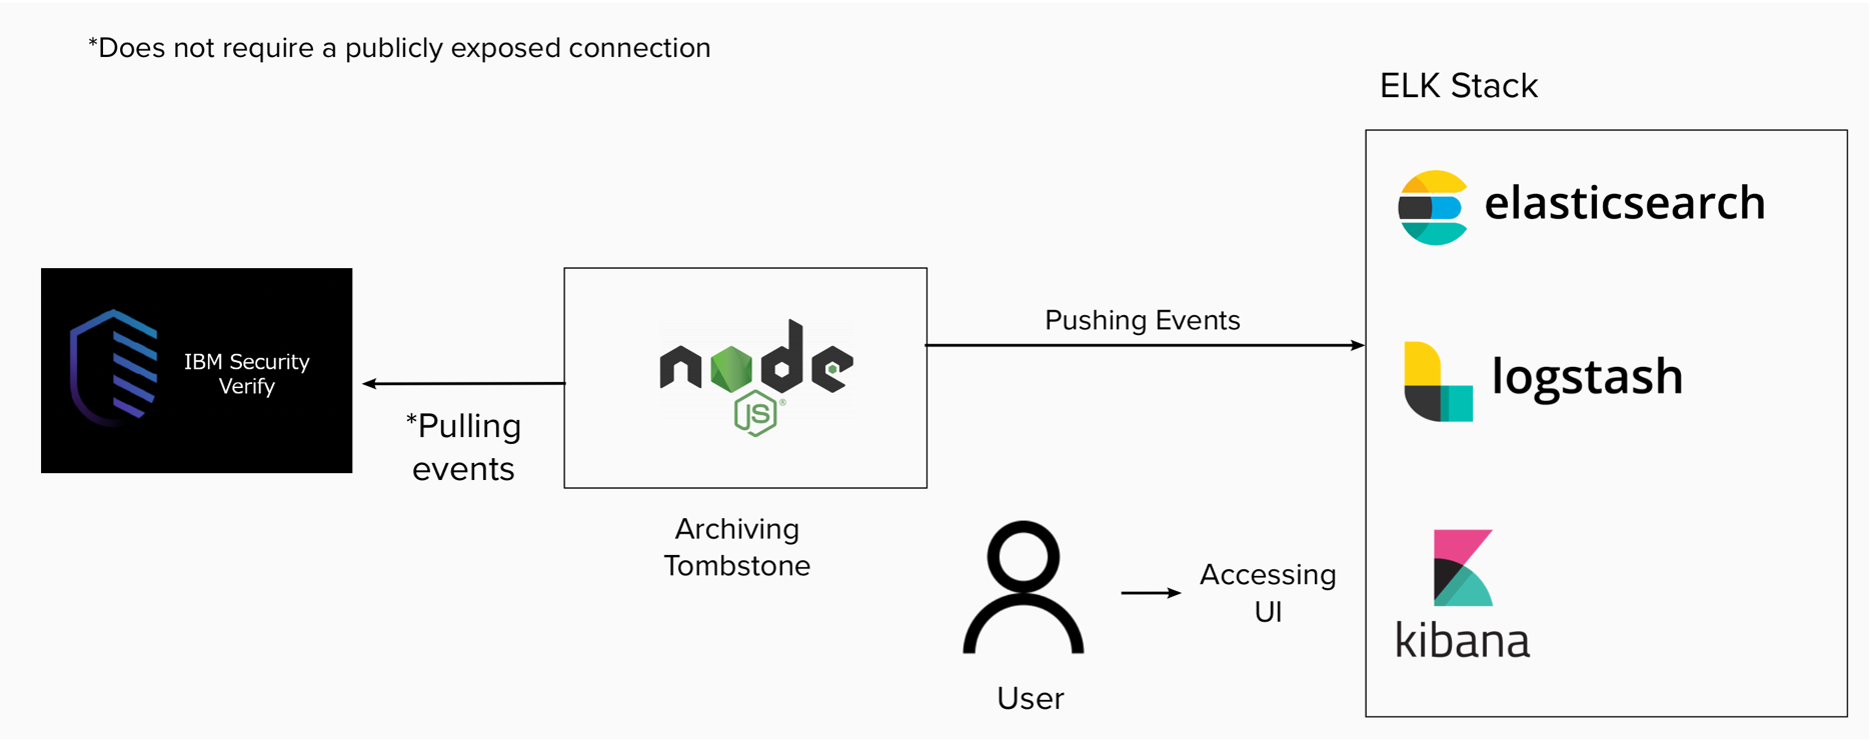
High level architecture
When first started, the tool reads configuration which provides:
- Connection information for your IBM Verify tenant
- Connection information for your ELK Stack
- Path of the file that contains the tombstone value for continuing after restart
Integration tool
The following code snippet shows the initialization of connections, the setup of the filter, and code to perform graceful shutdown on process exit:
// Initialize the request must wait for it!
await req.init(config);
await elkReq.init(config);

// Setting up the filter to process 1k events, getting the tombstone's
// initial value and then appending it to the filter
let filter = \"?all_events=yes&sort_order=asc&size=1000\";
let ts = JSON.parse(req.getTombstone(config.tombstone.fileName));
let filter2 = filter + '&from='+ ts.last;

let run = true;
// Enable grace full shutdown
process.on('SIGINT', function() {
  console.log(\"Caught interrupt signal - shutting down gracefully\");
  run = false;
});
Using the configuration data, the tool initializes connections to your IBM Verify tenant and to your ELK stack.
It then generates the filter that will be used when requesting events from IBM Verify. This filter starts with entries to request 1000 events sorted in ascending order. It then adds an entry to specify a start point based on the value read from the tombstone file.
The following code shows the run loop of the tool. This is an endless loop which pulls events from IBM Verify (1000 events at a time as defined by the filter).
while (run) {
    let list = await req.get(uri+filter2, { "Content-Type": "applications/json", "Accept": "application/json"});
    list = list.response.events;
    // check if the list is empty and sleep if needed
    if (list.events.length == 0) {
      log.debug("Pausing - ", stats.found);
      await req.sleep(30000);
    }
If no events are returned then the tool sleeps for 30 seconds before trying again.
If events are returned, the following code runs to process the events and send to your ELK stack as a bulk upload:
else {
        stats.found += list.events.length;
        log.trace("Count: ", stats.found);
        let payload = '';
        list.events.forEach( function (event, i) {
            payload += '{"create":{"_index": "' + elk.index + '", "_id": "' + event.id + '"}}\r\n';
            payload += JSON.stringify(event) + '\r\n';
      });

      elkReq.postEvents(payload);
      // print the event:
      let backupTimeStamp = list.search_after.time;
      // update the search filter
      filter2 = filter + '&from='+list.search_after.time;
      ts.last = list.search_after.time;
      req.putTombstone(config.tombstone.fileName, ts);

    }
  } // end of while
When receiving a bulk upload, the ELK stack expects each record to consist of two lines. The first line is JSON formatted metadata. The second line is a raw string that contains the event itself.
The metadata tells the ELK stack where to create the event (_index) and gives it an id (_id) to ensure that the event is unique. The tool uses the event id from IBM Verify as the id for the event in the ELK stack. This ensures that if the same event is sent multiple times it will not create multiple records in the ELK stack.
At the end of each successful upload, the tombstone file is updated so that the tool will continue after these events if it is restarted.
ELK Stack Install
The ELK stack used when creating this guide was v7.13.2 deployed on a RedHat box as a root user following these steps.
- Download the ELK stack by using the following instructions:
https://www.elastic.co/guide/en/elastic-stack/current/installing-elastic-stack.html
By default, everything is configured for localhost (127.0.0.1). To allow access from outside the host, you will need to bind the stack to an external IP address. This is covered in the following steps.
- As root user, edit the
/etc/elasticsearch/elasticsearch.ymlfile and edit the lines specifyingnetwork.hostanddiscover.seed_hosts(see example below):
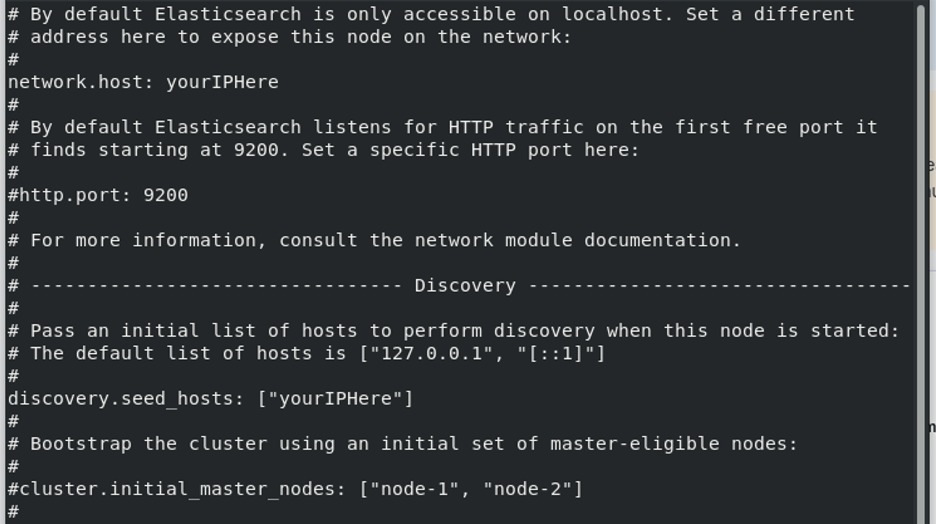
- As root user, edit the
/etc/logstash/logstash.ymlfile and edit the lines specifyinghttp.hostin the HTTP API Settings (see example below):
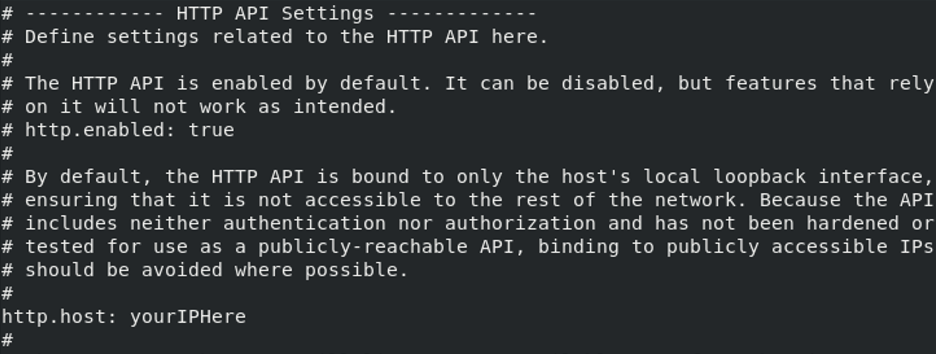
- As root user, edit the
/etc/kibana/kibana.ymlfile and edit the lines specifyingserver.hostandelasticserch.hosts(see examples below):


- Start the components of the ELK stack. To do this, run the following commands in order:
sudo systemctl start elasticsearch.service
sudo systemctl start kibana.service
sudo systemctl start logstash.service
- Test connectivity to the Elasticsearch service. Open a browser and navigate to:
http://your-hostname.example.com:9200
The response is a JSON object with details of the cluster:
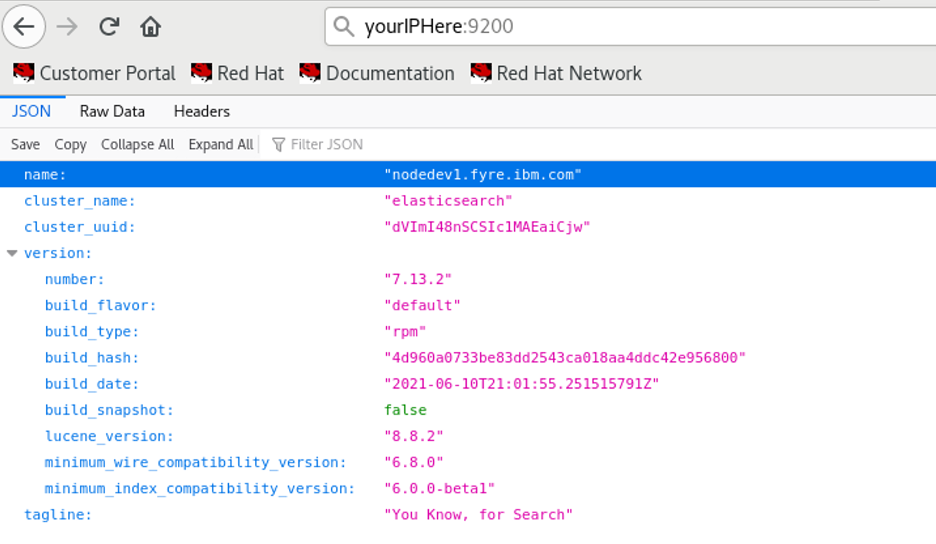
- Test connectivity to the Kibana web interface. By default, the Kibana UI runs on port 5601 so to access the user interface, type in the ip address or hostname where you are hosting the ELK stack and add :5601 to the end. For example:
http://your-hostname.example.com:5601
Tool Configuration
In env.js file for the integration tool, configure your IBM Verify tenant API Client id and api secret.
In the elk section of env.js, for ui specify the IP address or domain name where you are hosting the ELK stack and add :9200 to the end. for index, specify the index that you want to put the data into. If an index with the supplied name does not exist, then an index with that name will be created when the tool first runs.
elk: {
      ui: 'http://your-hostname.example.com:9200',
      index: 'yourIndexHere'
     },
In the tombstone section of env.js you can pass in a JSON file containing the tombstone time you wish to check from. For fileName, specify the path to the tombstone file.
tombstone: {
      fileName: './ts.json'
    },
The tombstone file has the following format:
{
  "last": "16149608629898"
}
The value for last is is an epoch in milliseconds and you can use 0 to start from the beginning if you desire. You will see that the value for last will be updated on a regular basis as the tool runs.
Run the integration tool"
To run the tool, user the following command:
node src/events/send.js
ELK Dashboard Creation
In order to proceed, you must have sent data to Logstash.
If you attempt to go to the discover tab right now, you will not see the index where you can get the information you need. To be able to access this information, click the hamburger button on the top left and then click on stack management
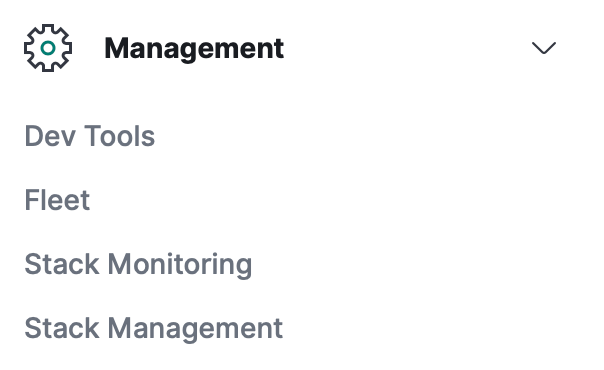
Under the Kibana section, click on “Index Patterns” and “Create Index Pattern”

Type in the name of the index and click next

In “Time field”, select “time” and click “create index pattern”

Now that the index pattern is created, we will be able to view it. Click the hamburger button and under the “Analytics” section, click on “Discover”.
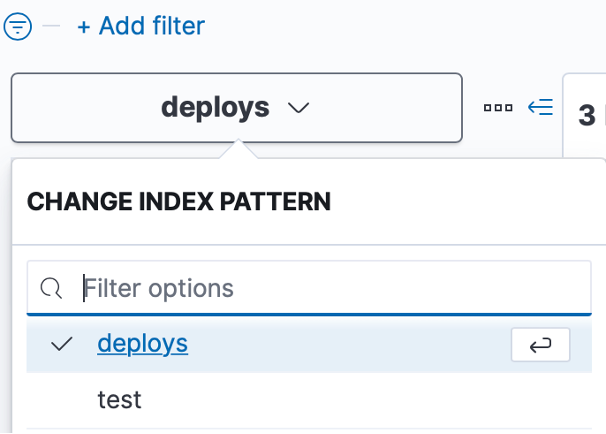
On the left part of the screen, there will be a dropdown menu. Select the index you wish to view from that dropdown menu.
You can click the calendar button on the top right side to change the time interval of events you are looking at
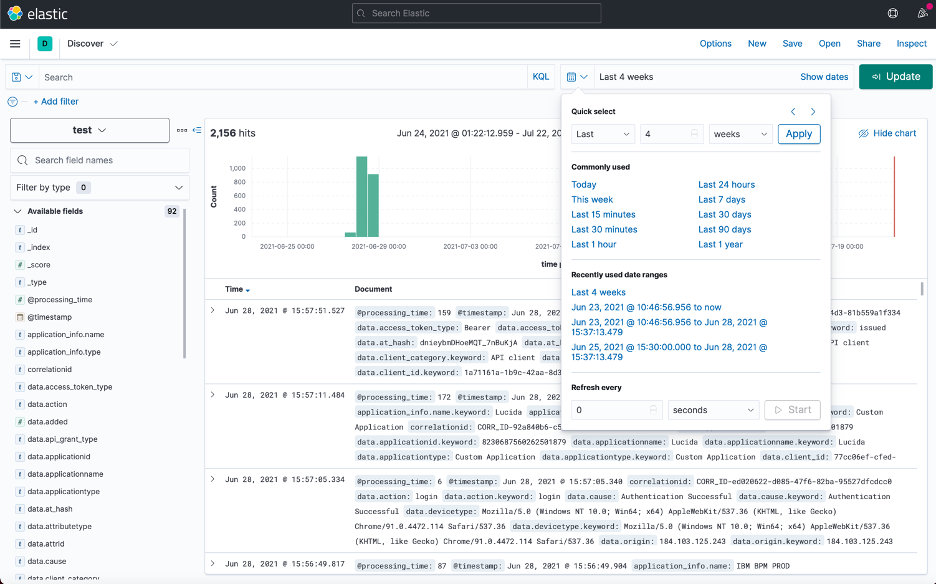
Congratulations! You can now analyse events from you IBM Verify tenant in Kibana.
Martin Schmidt, IBM Security Expert Labs
Martin Alvarez, IBM Security Expert Labs
Updated 21 days ago
